Logistic Regression
If linear regression serves to predict continuous Y variables, logistic regression is used for binary classification.
If we use linear regression to model a dichotomous variable (as Y), the resulting model might not restrict the predicted Ys within 0 and 1. Besides, other assumptions of linear regression such as normality of errors may get violated. So instead, we model the log odds of the event $ln \left( P \over 1-P \right)$, where, P is the probability of event.
$$Z_{i} = ln{\left(P_{i} \over 1-P_{i} \right)} = \beta_{0} + \beta_{1} x_{1} + . . + \beta_{n} x_{n} $$
The above equation can be modeled using the glm() by setting the family argument to "binomial". But we are more interested in the probability of the event, than the log odds of the event. So, the predicted values from the above model, i.e. the log odds of the event, can be converted to probability of event as follows:
$$P_{i} = 1 - {\left( 1 \over 1 + e^z_{i}\right)}$$
This conversion is achieved using the plogis() function, as shown below when we build logit models and predict.
Example Problem
Lets try and predict if an individual will earn more than $50K using logistic regression based on demographic variables available in the adult data. In this process, we will:
- Import the data
- Check for class bias
- Create training and test samples
- Compute information value to find out important variables
- Build logit models and predict on test data
- Do model diagnostics
Import data
inputData <- read.csv("http://rstatistics.net/wp-content/uploads/2015/09/adult.csv")
head(inputData)
#=>   AGE         WORKCLASS FNLWGT  EDUCATION EDUCATIONNUM       MARITALSTATUS
#=> 1  39         State-gov  77516  Bachelors           13       Never-married
#=> 2  50  Self-emp-not-inc  83311  Bachelors           13  Married-civ-spouse
#=> 3  38           Private 215646    HS-grad            9            Divorced
#=> 4  53           Private 234721       11th            7  Married-civ-spouse
#=> 5  28           Private 338409  Bachelors           13  Married-civ-spouse
#=> 6  37           Private 284582    Masters           14  Married-civ-spouse
#             OCCUPATION   RELATIONSHIP   RACE     SEX CAPITALGAIN CAPITALLOSS
#=> 1       Adm-clerical  Not-in-family  White    Male        2174           0
#=> 2    Exec-managerial        Husband  White    Male           0           0
#=> 3  Handlers-cleaners  Not-in-family  White    Male           0           0
#=> 4  Handlers-cleaners        Husband  Black    Male           0           0
#=> 5     Prof-specialty           Wife  Black  Female           0           0
#=> 6    Exec-managerial           Wife  White  Female           0           0
#     HOURSPERWEEK  NATIVECOUNTRY ABOVE50K
#=> 1           40  United-States        0
#=> 2           13  United-States        0
#=> 3           40  United-States        0
#=> 4           40  United-States        0
#=> 5           40           Cuba        0
#=> 6           40  United-States        0
Check Class bias
Ideally, the proportion of events and non-events in the Y variable should approximately be the same. So, lets first check the proportion of classes in the dependent variable ABOVE50K.
table(inputData$ABOVE50K)
#     0     1
# 24720  7841
Clearly, there is a class bias, a condition observed when the proportion of events is much smaller than proportion of non-events. So we must sample the observations in approximately equal proportions to get better models.
Create Training and Test Samples
One way to address the problem of class bias is to draw the 0’s and 1’s for the trainingData (development sample) in equal proportions. In doing so, we will put rest of the inputData not included for training into testData (validation sample). As a result, the size of development sample will be smaller that validation, which is okay, because, there are large number of observations (>10K).
# Create Training Data
input_ones <- inputData[which(inputData$ABOVE50K == 1), ]  # all 1's
input_zeros <- inputData[which(inputData$ABOVE50K == 0), ]  # all 0's
set.seed(100)  # for repeatability of samples
input_ones_training_rows <- sample(1:nrow(input_ones), 0.7*nrow(input_ones))  # 1's for training
input_zeros_training_rows <- sample(1:nrow(input_zeros), 0.7*nrow(input_ones))  # 0's for training. Pick as many 0's as 1's
training_ones <- input_ones[input_ones_training_rows, ]
training_zeros <- input_zeros[input_zeros_training_rows, ]
trainingData <- rbind(training_ones, training_zeros)  # row bind the 1's and 0's

# Create Test Data
test_ones <- input_ones[-input_ones_training_rows, ]
test_zeros <- input_zeros[-input_zeros_training_rows, ]
testData <- rbind(test_ones, test_zeros)  # row bind the 1's and 0's
Next it is desirable to find the information value of variables to get an idea of how valuable they are in explaining the dependent variable (ABOVE50K).
Create WOE for categorical variables (optional)
Optionally, we can create WOE equivalents for all categorical variables. This is only an optional step, for simplicity, this step is NOT run for this analysis.
for(factor_var in factor_vars){
  inputData[[factor_var]] <- WOE(X=inputData[, factor_var], Y=inputData$ABOVE50K)
}
head(inputData)
#>   AGE  WORKCLASS FNLWGT  EDUCATION EDUCATIONNUM MARITALSTATUS OCCUPATION
#> 1  39  0.1608547  77516  0.7974104           13    -1.8846680  -0.713645
#> 2  50  0.2254209  83311  0.7974104           13     0.9348331   1.084280
#> 3  38 -0.1278453 215646 -0.5201257            9    -1.0030638  -1.555142
#> 4  53 -0.1278453 234721 -1.7805021            7     0.9348331  -1.555142
#> 5  28 -0.1278453 338409  0.7974104           13     0.9348331   0.943671
#> 6  37 -0.1278453 284582  1.3690863           14     0.9348331   1.084280

#>   RELATIONSHIP        RACE        SEX CAPITALGAIN CAPITALLOSS HOURSPERWEEK
#> 1    -1.015318  0.08064715  0.3281187        2174           0           40
#> 2     0.941801  0.08064715  0.3281187           0           0           13
#> 3    -1.015318  0.08064715  0.3281187           0           0           40
#> 4     0.941801 -0.80794676  0.3281187           0           0           40
#> 5     1.048674 -0.80794676 -0.9480165           0           0           40
#> 6     1.048674  0.08064715 -0.9480165           0           0           40

#>   NATIVECOUNTRY ABOVE50K
#> 1    0.02538318        0
#> 2    0.02538318        0
#> 3    0.02538318        0
#> 4    0.02538318        0
#> 5    0.11671564        0
#> 6    0.02538318        0
Compute Information Values
The smbinning::smbinning function converts a continuous variable into a categorical variable using recursive partitioning. We will first convert them to categorical variables and then, capture the information values for all variables in iv_df
library(smbinning)
# segregate continuous and factor variables
factor_vars <- c ("WORKCLASS", "EDUCATION", "MARITALSTATUS", "OCCUPATION", "RELATIONSHIP", "RACE", "SEX", "NATIVECOUNTRY")
continuous_vars <- c("AGE", "FNLWGT","EDUCATIONNUM", "HOURSPERWEEK", "CAPITALGAIN", "CAPITALLOSS")

iv_df <- data.frame(VARS=c(factor_vars, continuous_vars), IV=numeric(14))  # init for IV results

# compute IV for categoricals
for(factor_var in factor_vars){
  smb <- smbinning.factor(trainingData, y="ABOVE50K", x=factor_var)  # WOE table
  if(class(smb) != "character"){ # heck if some error occured
    iv_df[iv_df$VARS == factor_var, "IV"] <- smb$iv
  }
}

# compute IV for continuous vars
for(continuous_var in continuous_vars){
  smb <- smbinning(trainingData, y="ABOVE50K", x=continuous_var)  # WOE table
  if(class(smb) != "character"){  # any error while calculating scores.
    iv_df[iv_df$VARS == continuous_var, "IV"] <- smb$iv
  }
}

iv_df <- iv_df[order(-iv_df$IV), ]  # sort
iv_df
#>           VARS     IV
#>   RELATIONSHIP 1.5739
#>  MARITALSTATUS 1.3356
#>            AGE 1.1748
#>    CAPITALGAIN 0.8389
#>     OCCUPATION 0.8259
#>   EDUCATIONNUM 0.7776
#>      EDUCATION 0.7774
#>   HOURSPERWEEK 0.4682
#>            SEX 0.3087
#>      WORKCLASS 0.1633
#>    CAPITALLOSS 0.1507
#>  NATIVECOUNTRY 0.0815
#>           RACE 0.0607
#>         FNLWGT 0.0000
Build Logit Models and Predict
logitMod <- glm(ABOVE50K ~ RELATIONSHIP + AGE + CAPITALGAIN + OCCUPATION + EDUCATIONNUM, data=trainingData, family=binomial(link="logit"))

predicted <- plogis(predict(logitMod, testData))  # predicted scores
# or
predicted <- predict(logitMod, testData, type="response")  # predicted scores
A quick note about the plogis function: The glm() procedure with family="binomial" will build the logistic regression model on the given formula. When we use the predict function on this model, it will predict the log(odds) of the Y variable. This is not what we ultimately want because, the predicted values may not lie within the 0 and 1 range as expected. So, to convert it into prediction probability scores that is bound between 0 and 1, we use the plogis().
Decide on optimal prediction probability cutoff for the model
The default cutoff prediction probability score is 0.5 or the ratio of 1’s and 0’s in the training data. But sometimes, tuning the probability cutoff can improve the accuracy in both the development and validation samples. The InformationValue::optimalCutoff function provides ways to find the optimal cutoff to improve the prediction of 1’s, 0’s, both 1’s and 0’s and o reduce the misclassification error. Lets compute the optimal score that minimizes the misclassification error for the above model.
library(InformationValue)
optCutOff <- optimalCutoff(testData$ABOVE50K, predicted)[1]
#=> 0.71
Model Diagnostics
The summary(logitMod) gives the beta coefficients, Standard error, z Value and p Value. If your model had categorical variables with multiple levels, you will find a row-entry for each category of that variable. That is because, each individual category is considered as an independent binary variable by the glm(). In this case it is ok if few of the categories in a multi-category variable don’t turn out to be significant in the model (i.e. p Value turns out greater than significance level of 0.5).
summary(logitMod)
#> Call:
#>   glm(formula = ABOVE50K ~ RELATIONSHIP + AGE + CAPITALGAIN + OCCUPATION +
#>         EDUCATIONNUM, family = "binomial", data = trainingData)
#>
#>   Deviance Residuals:
#>       Min       1Q   Median       3Q      Max
#>   -3.8380  -0.5319  -0.0073   0.6267   3.2847
#>
#>   Coefficients:
#>                                   Estimate  Std. Error z value             Pr(>|z|)
#>   (Intercept)                  -4.57657130  0.24641856 -18.572 < 0.0000000000000002 ***
#>   RELATIONSHIP Not-in-family   -2.27712854  0.07205131 -31.604 < 0.0000000000000002 ***
#>   RELATIONSHIP Other-relative  -2.72926866  0.27075521 -10.080 < 0.0000000000000002 ***
#>   RELATIONSHIP Own-child       -3.56051255  0.17892546 -19.899 < 0.0000000000000002 ***
#>   ...
#>   ...
#>   Null deviance: 15216.0  on 10975  degrees of freedom
#>   Residual deviance:  8740.9  on 10953  degrees of freedom
#>   AIC: 8786.9
#>
#>   Number of Fisher Scoring iterations: 8
VIF
Like in case of linear regression, we should check for multicollinearity in the model. As seen below, all X variables in the model have VIF well below 4.
vif(logitMod)
#>                  GVIF Df GVIF^(1/(2*Df))
#> RELATIONSHIP 1.340895  5        1.029768
#> AGE          1.119782  1        1.058198
#> CAPITALGAIN  1.023506  1        1.011685
#> OCCUPATION   1.733194 14        1.019836
#> EDUCATIONNUM 1.454267  1        1.205930
Misclassification Error
Misclassification error is the percentage mismatch of predcited vs actuals, irrespective of 1’s or 0’s. The lower the misclassification error, the better is your model.
misClassError(testData$ABOVE50K, predicted, threshold = optCutOff)
#=> 0.0899
ROC
Receiver Operating Characteristics Curve traces the percentage of true positives accurately predicted by a given logit model as the prediction probability cutoff is lowered from 1 to 0. For a good model, as the cutoff is lowered, it should mark more of actual 1’s as positives and lesser of actual 0’s as 1’s. So for a good model, the curve should rise steeply, indicating that the TPR (Y-Axis) increases faster than the FPR (X-Axis) as the cutoff score decreases. Greater the area under the ROC curve, better the predictive ability of the model.
plotROC(testData$ABOVE50K, predicted)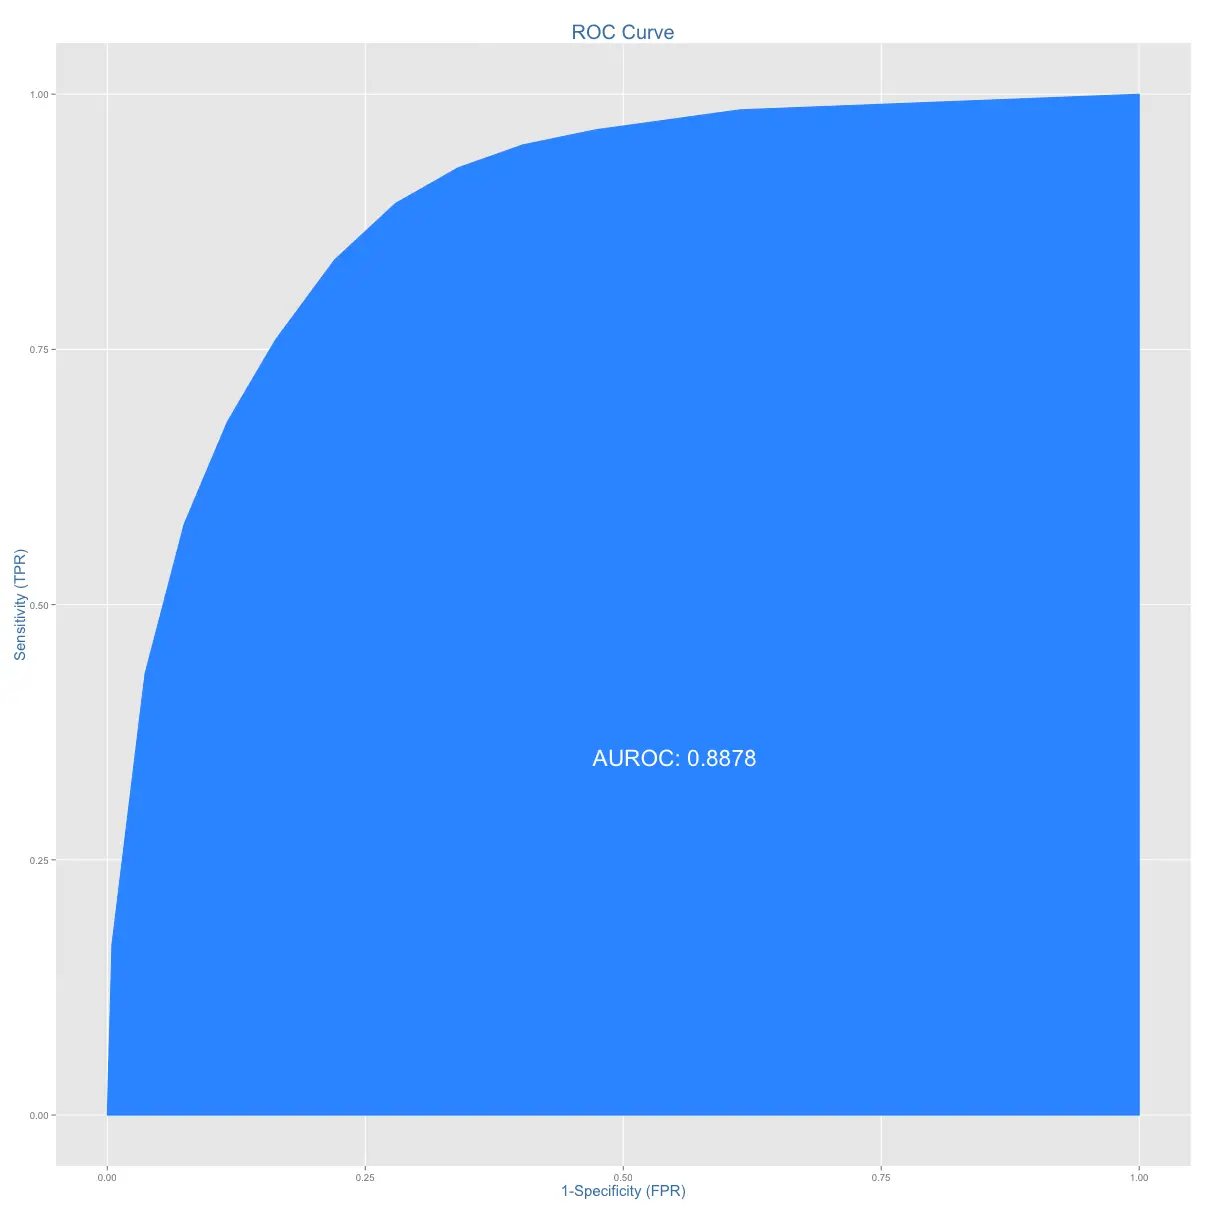
The above model has area under ROC curve 88.78%, which is pretty good.
Concordance
Ideally, the model-calculated-probability-scores of all actual Positive’s, (aka Ones) should be greater than the model-calculated-probability-scores of ALL the Negatives (aka Zeroes). Such a model is said to be perfectly concordant and a highly reliable one. This phenomenon can be measured by Concordance and Discordance.
In simpler words, of all combinations of 1-0 pairs (actuals), Concordance is the percentage of pairs, whose scores of actual positive’s are greater than the scores of actual negative’s. For a perfect model, this will be 100%. So, the higher the concordance, the better is the quality of model.
Concordance(testData$ABOVE50K, predicted)
#> 0.8915
The above model with a concordance of 89.2% is indeed a good quality model.
Specificity and Sensitivity
Sensitivity (or True Positive Rate) is the percentage of 1’s (actuals) correctly predicted by the model, while, specificity is the percentage of 0’s (actuals) correctly predicted. Specificity can also be calculated as 1 − False Positive Rate.
$$Sensitivity = \frac{\# \ Actual \ 1's \ and \ Predicted \ as \ 1's}{\# \ of \ Actual \ 1's}$$
$$Specificity = {\# \ Actual \ 0's \ and \ Predicted \ as \ 0's \over \# \ of \ Actual \ 0's}$$
sensitivity(testData$ABOVE50K, predicted, threshold = optCutOff)
#> 0.3089
specificity(testData$ABOVE50K, predicted, threshold = optCutOff)
#> 0.9836
The above numbers are calculated on the validation sample that was not used for training the model. So, a truth detection rate of 31% on test data is good.
Confusion Matrix
confusionMatrix(testData$ABOVE50K, predicted, threshold = optCutOff)
# The columns are actuals, while rows are predicteds.
#>       0    1
#> 0 18918 1626
#> 1   314  727